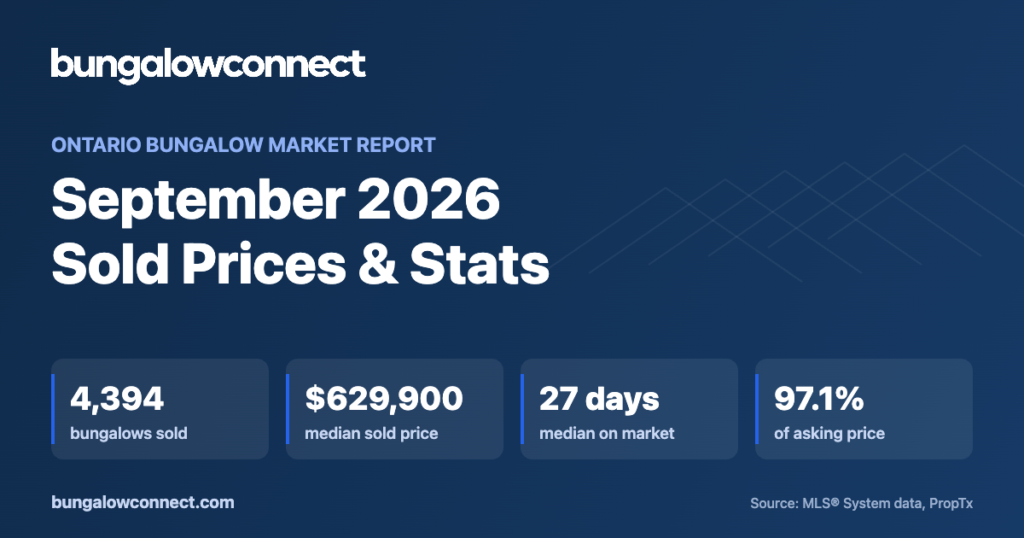
4,394 bungalow-style homes sold across Ontario in September 2026 at a median price of $629,900, almost unchanged from August ($625,000). Homes took a median 27 days to sell and went for 97.1% of their asking price, and with sales running at 38% of new listings, bungalows were in a buyer’s market for the month. This report breaks the numbers down by region, city, style, bedrooms and price range, with a separate look at the GTA.
* Compared with the same regions a year earlier. See how these numbers are calculated below.
September 2026 bungalow market: the short version
- 4,493 bungalow-style homes sold across Ontario at a median price of $625,000, up 0.8% from August. In regions with complete data both years, the median was $625,000, down 4.2% from a year earlier.
- In the GTA (Toronto, York, Peel, Durham and Halton), 884 sold at a median of $895,800, 97.0% of asking.
- The typical bungalow took 27 days to sell and went for 97.1% of its asking price; 15% sold over asking.
- With 4,493 sales against 12,268 new listings (a 37% sales-to-new-listings ratio), bungalows were in a buyer's market.
- Busiest markets: Toronto (340), Hamilton (141), Thunder Bay (86), Mississauga (85), Kawartha Lakes (84).
Ontario bungalow sold prices: last 13 months
Show the monthly numbers as a table
| Month | Median sold price | Median days on market | Sold vs asking |
|---|---|---|---|
| Sep 2026 | $625,000 | 27 | 97.1% |
| Aug 2026 | $620,000 | 28 | 97.1% |
| Jul 2026 | $631,300 | 26 | 97.3% |
| Jun 2026 | $645,800 | 21 | 97.6% |
| May 2026 | $655,000 | 20 | 97.8% |
| Apr 2026 | $660,000 | 20 | 97.7% |
| Mar 2026 | $650,000 | 20 | 97.7% |
| Feb 2026 | $640,000 | 25 | 97.2% |
| Jan 2026 | $640,000 | 44 | 96.7% |
| Dec 2025 | $625,000 | 35 | 96.4% |
| Nov 2025 | $643,000 | 28 | 97.0% |
| Oct 2025 | $650,000 | 27 | 97.1% |
| Sep 2025 | $652,700 | 26 | 97.1% |
Bungalow sold prices by region, September 2026
Every region with at least five bungalow sales in September, busiest first. Tap a region to see bungalows for sale there.
| Region | Sold | Median sold price | Average sold price | Median days on market | Sold vs asking | Median vs last year |
|---|---|---|---|---|---|---|
| Toronto | 340 | $921,000 | $1,034,400 | 15 | 97.3% | -9.3% |
| Simcoe County | 324 | $650,000 | $714,000 | 35 | 96.5% | -4.4% |
| Niagara Region | 305 | $565,000 | $616,300 | 24 | 96.6% | -5.0% |
| Middlesex | 242 | $535,000 | $594,200 | 26 | 97.2% | -3.6% |
| Durham Region | 175 | $730,000 | $827,700 | 17 | 97.6% | -7.7% |
| Ottawa | 163 | $718,000 | $796,700 | 21 | 97.5% | -1.6% |
| Peel Region | 158 | $850,000 | $915,200 | 21 | 96.6% | -7.5% |
| Hamilton | 141 | $629,900 | $665,300 | 28 | 96.8% | -13.1% |
| Peterborough | 135 | $598,000 | $653,700 | 33 | 96.5% | -3.5% |
| Wellington | 117 | $745,000 | $876,700 | 31 | 97.4% | -6.3% |
| Thunder Bay | 116 | $385,000 | $417,300 | 19 | 104.7% | +13.2% |
| Waterloo Region | 115 | $678,000 | $719,900 | 14 | 99.3% | -1.7% |
| Halton Region | 110 | $1,005,500 | $1,123,300 | 16 | 96.5% | -8.6% |
| Hastings | 108 | $475,000 | $490,800 | 32 | 97.0% | -8.7% |
| York Region | 101 | $1,060,000 | $1,146,100 | 28 | 95.9% | +5.2% |
| Stormont, Dundas and Glengarry | 95 | $439,000 | $438,900 | 30 | 97.0% | +2.1% |
| Renfrew | 95 | $470,000 | $540,800 | 38 | 96.9% | +14.2% |
| Algoma | 94 | $310,000 | $323,900 | 30 | 96.1% | -1.6% |
| Oxford | 92 | $566,300 | $675,000 | 31 | 97.4% | -5.5% |
| Northumberland | 90 | $617,500 | $637,600 | 32 | 96.9% | -5.4% |
| Grey County | 89 | $570,000 | $637,600 | 61 | 96.0% | -12.0% |
| Leeds and Grenville | 85 | $528,000 | $542,300 | 37 | 97.0% | +5.1% |
| Muskoka | 85 | $682,500 | $1,084,000 | 31 | 95.2% | -8.4% |
| Kawartha Lakes | 84 | $622,500 | $686,900 | 38 | 95.6% | -3.1% |
| Nipissing | 82 | $417,500 | $445,900 | 20 | 97.7% | -14.8% |
| Bruce | 81 | $540,000 | $545,400 | 41 | 96.8% | -3.3% |
| Frontenac | 77 | $573,000 | $613,600 | 37 | 96.8% | 0.0% |
| Cochrane | 70 | $320,000 | $332,400 | 23 | 97.7% | +16.4% |
| Elgin | 63 | $510,000 | $592,500 | 35 | 96.8% | -3.4% |
| Lanark | 61 | $565,000 | $634,100 | 23 | 98.1% | -2.6% |
| Huron | 59 | $495,000 | $603,200 | 29 | 97.6% | -2.0% |
| Parry Sound | 58 | $526,300 | $701,800 | 46 | 95.3% | -8.5% |
| Prescott and Russell | 50 | $546,800 | $546,400 | 26 | 98.0% | +3.3% |
| Perth | 49 | $595,000 | $615,300 | 31 | 97.9% | -4.0% |
| Haliburton | 47 | $533,000 | $560,700 | 40 | 95.4% | -12.6% |
| Lennox & Addington | 43 | $525,000 | $539,200 | 42 | 97.3% | -7.9% |
| Kenora | 43 | $365,000 | $473,700 | 25 | 97.9% | +4.6% |
| Dufferin County | 32 | $745,000 | $815,600 | 31 | 96.5% | -6.9% |
| Brantford | 32 | $590,000 | $606,100 | 25 | 97.7% | +2.6% |
| Norfolk | 29 | $590,000 | $632,900 | 61 | 96.6% | -6.3% |
| Lambton | 29 | $487,500 | $620,600 | 78 | 95.3% | -18.7% |
| Prince Edward County | 27 | $745,000 | $782,700 | 33 | 96.9% | +42.6% |
| Timiskaming | 26 | $279,100 | $304,400 | 21 | 96.8% | +14.4% |
| Haldimand | 26 | $607,400 | $659,200 | 52 | 96.9% | -10.0% |
| Brantford & Brant | 16 | $899,900 | $966,700 | 49 | 97.0% | +28.1% |
| Rainy River | 16 | $319,000 | $356,000 | 36 | 98.0% | +32.9% |
| Chatham-Kent | 8 | $462,500 | $742,800 | 82 | 94.8% | – |
"Median vs last year" is shown only where the region had comparable sales data a year ago.
GTA bungalow market, September 2026
Across Toronto, York, Peel, Durham and Halton, 884 bungalows sold in September at a median of $895,800 and an average of $996,000. Homes took a median 18 days to sell and closed at 97.0% of asking, with 20% selling over asking.
Bungalow sold prices by city
The 25 busiest cities and towns for bungalow sales in September (five or more sales each).
| City | Region | Sold | Median sold price | Days on market | Sold vs asking |
|---|---|---|---|---|---|
| Toronto | Toronto | 340 | $921,000 | 15 | 97.3% |
| Hamilton | Hamilton | 141 | $629,900 | 28 | 96.8% |
| Thunder Bay | Thunder Bay | 86 | $385,000 | 16 | 105.7% |
| Mississauga | Peel Region | 85 | $930,000 | 21 | 96.7% |
| Kawartha Lakes | Kawartha Lakes | 84 | $622,500 | 38 | 95.6% |
| London South | Middlesex | 77 | $542,000 | 24 | 97.6% |
| London East | Middlesex | 68 | $471,300 | 30 | 97.0% |
| Niagara Falls | Niagara Region | 61 | $540,000 | 30 | 96.2% |
| St. Catharines | Niagara Region | 60 | $560,000 | 18 | 96.8% |
| Oshawa | Durham Region | 59 | $640,000 | 19 | 97.2% |
| Peterborough | Peterborough | 57 | $546,500 | 29 | 97.2% |
| Burlington | Halton Region | 52 | $1,005,500 | 14 | 97.0% |
| Kitchener | Waterloo Region | 52 | $672,500 | 13 | 100.2% |
| Brampton | Peel Region | 51 | $755,000 | 15 | 97.2% |
| Kingston | Frontenac | 51 | $573,000 | 31 | 97.1% |
| Sault Ste Marie | Algoma | 50 | $322,500 | 20 | 97.8% |
| North Bay | Nipissing | 48 | $423,600 | 14 | 98.4% |
| Fort Erie | Niagara Region | 45 | $529,900 | 50 | 96.4% |
| Welland | Niagara Region | 45 | $510,000 | 24 | 96.5% |
| Barrie | Simcoe County | 43 | $655,000 | 29 | 97.0% |
| Timmins | Cochrane | 42 | $360,000 | 19 | 101.4% |
| Guelph | Wellington | 42 | $747,500 | 19 | 97.9% |
| Belleville | Hastings | 42 | $495,000 | 24 | 97.8% |
| Cornwall | Stormont, Dundas and Glengarry | 42 | $430,000 | 27 | 98.1% |
| Clarington | Durham Region | 39 | $742,500 | 15 | 97.8% |
Highest median sold prices
- Erin: $1,325,000
- Markham: $1,282,900
- Whitchurch-Stouffville: $1,250,000
- Vaughan: $1,240,000
- Oakville: $1,195,000
Most affordable bungalow markets
- Kirkland Lake: $155,000
- Cochrane: $182,500
- Kapuskasing: $218,000
- Thessalon: $228,000
- Elliot Lake: $250,000
Prices by bungalow style
| Style | Sold | Median sold price | Days on market | Sold vs asking |
|---|---|---|---|---|
| Bungalow | 2,700 | $612,500 | 28 | 97.0% |
| 1½ storey | 559 | $468,000 | 28 | 96.4% |
| Raised bungalow | 541 | $655,000 | 29 | 97.2% |
| Backsplit | 308 | $737,500 | 22 | 97.3% |
| Sidesplit | 285 | $725,000 | 22 | 97.3% |
| Bungaloft | 100 | $822,500 | 37 | 97.0% |
Detached, semi and condo bungalows
| Home type | Sold | Median sold price | Days on market |
|---|---|---|---|
| Detached | 3,954 | $630,000 | 26 |
| Semi-detached | 210 | $603,500 | 25 |
| Condo bungalow | 124 | $587,000 | 43 |
| Townhouse | 72 | $594,500 | 41 |
Prices by number of bedrooms
| Bedrooms | Sold | Median sold price | Days on market |
|---|---|---|---|
| 1 bedroom | 130 | $489,500 | 31 |
| 2 bedrooms | 1,437 | $553,800 | 29 |
| 3 bedrooms | 2,442 | $646,300 | 25 |
| 4+ bedrooms | 467 | $780,000 | 32 |
How many bungalows sold in each price range
Supply and demand: buyer's or seller's market?
12,268 bungalow-style homes were newly listed in September. That puts the sales-to-new-listings ratio at 37%. Below 40% usually favours buyers, above 60% favours sellers, so bungalows were in a buyer's market.
Frequently asked questions
What is the average price of a bungalow in Ontario in September 2026?
The median sold price of a bungalow-style home in Ontario in September 2026 was $625,000, and the average was $696,400, based on 4,493 sales on the MLS® System. The median is down 4.2% from a year earlier.
How much does a bungalow cost in the GTA?
In September 2026, 884 bungalows sold across Toronto, York, Peel, Durham and Halton at a median price of $895,800 (average $996,000).
Are bungalows selling over asking price right now?
Bungalows sold for a median 97.1% of their asking price in September 2026, and 15% sold for more than asking. Most buyers are negotiating below the list price.
How long does it take to sell a bungalow in Ontario?
The median bungalow sold in 27 days on market in September 2026. Homes priced in line with recent sales nearby usually sell fastest.
Is it a buyer's or seller's market for bungalows?
With 4,493 sales and 12,268 new listings, the sales-to-new-listings ratio was 37% in September 2026, which points to a buyer's market for bungalows.
Where are the most bungalows selling in Ontario?
Toronto had the most bungalow sales in September 2026 (340, median $921,000). The highest median price among busy markets was in Erin ($1,325,000), and the most affordable was Kirkland Lake ($155,000).
Where can I see bungalows that sold near me?
Create a free BungalowConnect account to see the address, sold price, photos and price history of every bungalow that sold, and get alerts when one sells near you. See sold bungalows.
How these numbers are calculated
Figures cover bungalows, raised bungalows, bungalofts, sidesplits, backsplits and 1½-storey homes sold through the MLS® System across Ontario, with a sale date (the day the deal firmed up: list date plus days on market, not the later closing date) in September, 2026. Medians are the middle sale, so a few very high or low sales do not skew them. "Sold vs asking" compares each sold price with its final list price. New listings count every bungalow-style listing that came on the market in the period, including homes relisted after a price or brokerage change. * Year-over-year changes compare only regions with at least ten sales in both years and comparable coverage, because some local boards joined the MLS® data feed during the past year; the 13-month charts use the same regions throughout. Sales are sometimes reported late, so figures can shift slightly after publication. Source: PropTx (TRREB) MLS® System data; the information is deemed reliable but is not guaranteed. Updated November 9, 2026.
Browse bungalows for sale in Ontario, or read more bungalow market reports and guides.
Bungalow market reports by city
For listings, asking prices and neighbourhood detail in a single city, see the monthly city reports:
- Barrie Bungalow Market Report
- Brampton Bungalow Market Report
- Burlington Bungalow Market Report
- Hamilton Bungalow Market Report
- Markham Bungalow Market Report
- Mississauga Bungalow Market Report
- Newmarket and Aurora Bungalow Market Report
- Oakville Bungalow Market Report
- Oshawa Bungalow Market Report
- Pickering and Ajax Bungalow Market Report
- Richmond Hill Bungalow Market Report
- Toronto Bungalow Market Report
- Vaughan Bungalow Market Report
- Whitby Bungalow Market Report
Looking for this month? See the live October 2026 Ontario bungalow market report, updated daily, or read what the September GTA housing numbers mean for bungalow buyers.
Bungalows for sale in Toronto, Hamilton and Mississauga
Live listings from the places in this article.
 $799,00037 Petiole Road, Toronto3+2 bed · 2 bath · Glenfield-Jane HeightsCourtesy of CENTURY 21 ATRIA REALTY INC.
 $979,90028 Belleglade Court, Toronto3+1 bed · 2 bath · HumbermedeCourtesy of DREAMWORLD REALTY INC.
 $1,599,000338 Carlisle Road, Hamilton4+1 bed · 3 bath · CarlisleCourtesy of ROYAL LEPAGE BURLOAK REAL ESTATE SERVICES
 $199,900129 Britannia Avenue, Hamilton2 bed · 1 bath · Crown PointCourtesy of RE/MAX ESCARPMENT GOLFI REALTY INC.
 $838,8003766 Darla Drive E, Mississauga3+2 bed · 2 bath · MaltonCourtesy of HOMELIFE/VISION REALTY INC.
 $719,4503556 Monica Drive, Mississauga3+1 bed · 2 bath · MaltonCourtesy of RIGHT AT HOME REALTY