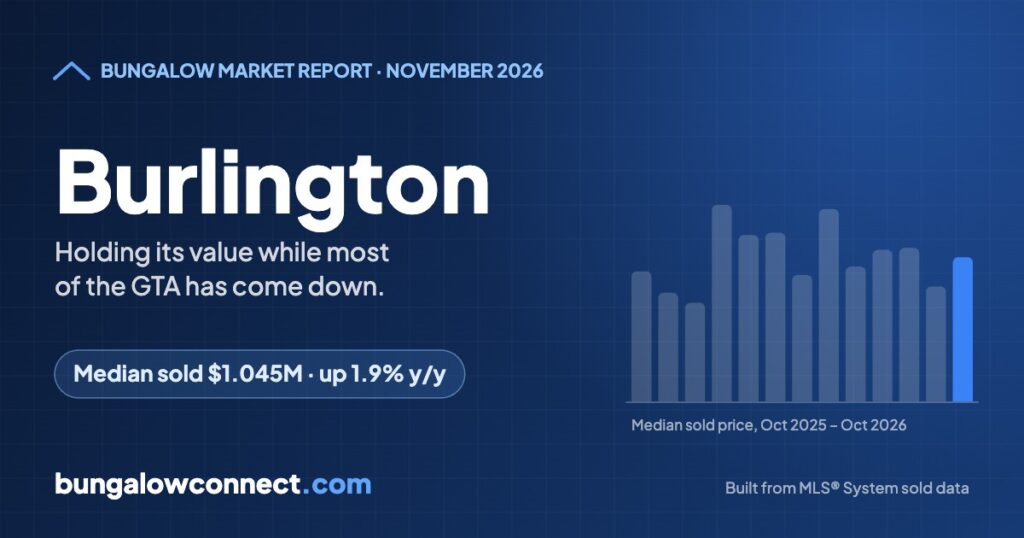
While bungalow prices across most of the GTA are lower than they were in 2024, Burlington is holding its ground. The October 2026 median sold price was $1,045,000, up 1.9% from a year ago and 1.8% from October 2024. Among GTA cities with 25 or more bungalow sales in October, Burlington was the only one priced higher than both one and two years ago.
Burlington, October 2026
- Median sold price $1,045,000, up 3.9% from September
- 57 sold (52 in September)
- 18 days to sell
- 97.5% of asking; 23% sold over asking
- 185 for sale on November 1, about 3.2 months of supply
Why Burlington bungalows are holding value
Burlington draws a steady mix of bungalow buyers: downsizers who want one-floor living near the lake, and buyers who want easy access to the QEW and the Lakeshore West GO line. With about 3.2 months of supply, there are fewer bungalows for sale relative to sales than in Mississauga or Oakville, which helps keep prices steady.
The numbers back that up. Over the past 13 months the monthly median has ranged from $984,000 to $1,116,000, and October’s $1,045,000 sits in the middle of that band. Nearly a quarter of homes sold over asking, close to Toronto’s 28% and well above Mississauga’s 15%.
Burlington bungalow sold prices: last 13 months
| Month | Sold | Median sold price | Median days on market | Sold vs asking |
|---|---|---|---|---|
| Oct 2026 | 57 | $1,045,000 | 18 | 97.5% |
| Sep 2026 | 52 | $1,005,500 | 14 | 97.0% |
| Aug 2026 | 50 | $1,057,500 | 18 | 97.2% |
| Jul 2026 | 70 | $1,055,000 | 21 | 97.0% |
| Jun 2026 | 86 | $1,032,500 | 20 | 97.0% |
| May 2026 | 63 | $1,110,000 | 12 | 98.2% |
| Apr 2026 | 73 | $1,021,000 | 14 | 97.3% |
| Mar 2026 | 56 | $1,078,000 | 13 | 98.1% |
| Feb 2026 | 35 | $1,075,000 | 16 | 96.7% |
| Jan 2026 | 30 | $1,115,500 | 22 | 96.5% |
| Dec 2025 | 30 | $983,500 | 42 | 95.9% |
| Nov 2025 | 39 | $997,100 | 15 | 97.5% |
| Oct 2025 | 58 | $1,026,000 | 20 | 97.0% |
How Burlington compares, October 2026
| Area | Sold | Median sold price | Days on market | Sold vs asking | Sold over asking |
|---|---|---|---|---|---|
| Burlington | 57 | $1,045,000 | 18 | 97.5% | 23% |
| Halton Region | 113 | $1,075,900 | 19 | 96.7% | 13% |
| GTA | 953 | $894,000 | 20 | 97.0% | 20% |
| All of Ontario | 4,352 | $620,000 | 27 | 97.0% | 15% |
Nearby bungalow markets, October 2026
| Town | Sold | Median sold price | Days on market | Sold vs asking |
|---|---|---|---|---|
| Oakville | 30 | $1,350,000 | 30 | 95.4% |
| Halton Hills | 21 | $809,900 | 13 | 97.0% |
| Milton | 5 | $950,000 | 14 | 97.0% |
See every bungalow that sold in Burlington
Addresses, sold prices, photos and full price history for each sale. Free with a BungalowConnect account.
Figures cover bungalows, raised bungalows, bungalofts, sidesplits, backsplits and 1½-storey homes in Burlington sold through the MLS® System, dated by the day the deal firmed up. Medians are the middle sale, so a few very high or low sales do not skew them. Source: PropTx (TRREB) MLS® System data; deemed reliable but not guaranteed. Updated November 1, 2026.
Burlington against its neighbours
A Burlington bungalow cost about $51,000 more than one in Mississauga in October ($1,045,000 vs $994,000) and about $305,000 less than one in Oakville ($1,350,000). Burlington homes also sold faster than Oakville’s (18 days vs 30.5) and for a higher share of asking (97.5% vs 95.4%).
What’s for sale
185 bungalows were listed on November 1, with 30 added in the past week. The median asking price is $1.22 million, and the typical listing has been up for 28 days. Price per square foot on current listings averages about $833.
Buying in Burlington: what to know
- Good homes go quickly. 18 days is the median, and nearly a quarter sold over asking, so be ready to move on the right home.
- Check the lot. Many Burlington bungalows sit on wide lots that are valuable for additions or a future rebuild, so the land can be worth as much as the house.
- Compare with sold history, not asking prices. The gap between the $1.22 million median asking price and the $1,045,000 median sold price shows that many listings are priced above where homes are selling.
Frequently asked questions
How much is a bungalow in Burlington?
The median sold price was $1,045,000 in October 2026, and the average was $1,052,900.
Are Burlington bungalow prices going up?
Slightly. The October 2026 median was 1.9% higher than a year earlier and 1.8% higher than in October 2024.
How fast do bungalows sell in Burlington?
The median was 18 days in October 2026, and 23% sold over asking.
Keep exploring
- Bungalows for sale in Burlington, updated every 15 minutes
- Burlington bungalow market report, October 2026 (what was listed and what sellers were asking)
- Ontario bungalow market report, October 2026
- What’s my bungalow worth?
Bungalows for sale in Burlington, Mississauga and Oakville
Live listings from the places in this article.
 $899,0001397 Charles Drive, Burlington3+1 bed · 2 bath · MountainsideCourtesy of RE/MAX COMMUNITY REALTY INC.
 $1,299,99924 - 4400 Millcroft Park Drive, Burlington2+2 bed · 3 bath · RoseCourtesy of RE/MAX ABOUTOWNE REALTY CORP.
 $1,299,0003058 Greta Gate, Mississauga3 bed · 2 bath · ApplewoodCourtesy of RE/MAX REALTY SPECIALISTS INC.
 $1,348,0001876 Bough Beeches Boulevard, Mississauga3+1 bed · 3 bath · RathwoodCourtesy of RE/MAX REAL ESTATE CENTRE INC.
 $830,0001142 Falgarwood Drive, Oakville3 bed · 2 bath · 1005 - FA FalgarwoodCourtesy of ACCSELL REALTY INC.
 $1,349,0002470 Meadowood Crescent, Oakville3 bed · 2 bath · 1001 - BR BronteCourtesy of SAM MCDADI REAL ESTATE INC.